
One of the longest-lasting stats projects I’ve made, the Big Bash League Elo Ratings started out when I was bored in a Year 8 class at my old high school. They originally served just as a timeline of ratings, confined entirely to the Numbers spreadsheet I’d been putting them down in.
Shortly afterwards, though, I realised another thing that I could do – one of the cool things of Elo is that you can use it to predict results. So I uploaded that to Google Sheets, made another spreadsheet, and filled it with individual match winning chances, and the chances a team would have x wins after y games.
They were eventually published on October 18, 2016, on the old blog Statscrunch (the post is preserved for posterity here on the Wayback Machine). I spent that summer updating the ratings after each game and tweeting the new predictions, which started gaining attention in the Twittersphere.
When I moved across to the new website, I took the Elo ratings with me, and here they are, updated for 2017-18.
What’s an Elo?
Some of you might be a little lost here, and won’t have any idea of what the Elo ratings system is. That’s what this section is here to explain.
The Elo system is named after their inventor, Arpad Elo (born Élő Árpád Imre). Originally from the village of Egyházaskesző,1 Elo and his parents moved to the United States when he was ten. Elo would grow up to become a professor of physics at Marquette University and the best chess player in Milwaukee.
In 1950, the United States Chess Federation began using the Harkness Rating System, developed by Scotsman Kenneth Harkness.2 That format did lead to a few unusual results, though, so the USCF asked Elo to come up with a new system, which he did.
The Elo system works with the following formulae:
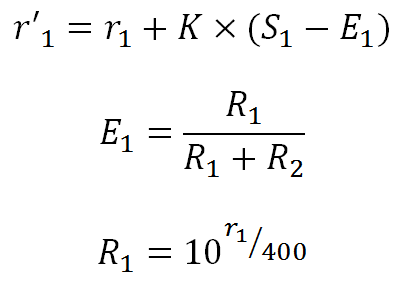
The formula looks at a team’s expected chance of winning, compares that to whether they actually won, and adjusts the rating occasionally.
To illustrate it, we’ll assume that a team with a rating (r) of 1600 is playing one with a rating of 1400. First of all, we’ll work out the team’s transformed rating (R), which is used to make the rest of the procedure smoother.
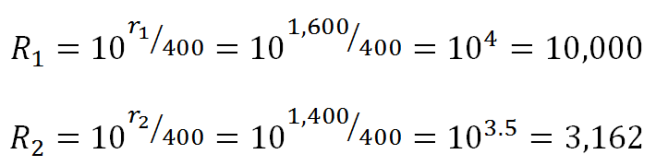
There we go. Pretty big difference, heh?
These ratings then appear in our next calculation, looking at the expected winning chances (E).
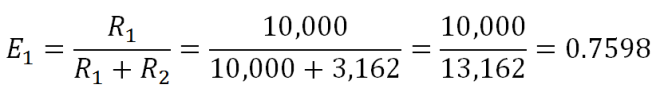
So Team 1, the team with the much higher rating, has a 76% chance of winning the game. Team 2, of course, has a 24% chance (as things must add to one).
If Team 1 would get a win from this game (S), then the ratings would change like this (using a K factor of 20):

Team 1’s rating goes up by five, and Team 2’s goes down by the same. But what happens if there’s an upset?
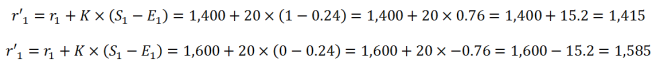
The ratings change by much more, which is one of the joys of the Elo system: you get more points for an upset victory than you do for an expected one.
So of course there’s one question you can’t wait to see: which team’s on top?
And the answer, ahead of BBL|07, is the Perth Scorchers.
And it’s not even close. The team who’ve made every final but one, and the three-time champions, are forty points clear of their nearest opponent, the Melbourne Stars.
Down at the southernmost end of the ratings is the southernmost team in the league, the Hobart Hurricanes, who are nearly 100 points behind the Scorchers.
Elo ratings – ahead of BBL\07
| Team | Rating | |
| 1 | Perth Scorchers | 1551 |
| 2 | Melbourne Stars | 1511 |
| 3 | Sydney Sixers | 1501 |
| 4 | Brisbane Heat | 1497 |
| 5 | Adelaide Strikers | 1490 |
| Melbourne Renegades | 1490 | |
| Sydney Thunder | 1490 | |
| 8 | Hobart Hurricanes | 1469 |
The Scorchers have dominated the ratings for years. Out of their 65 ratings throughout history, 27 of them have been over the 1550 mark. As a contrast, the entire rest of the competition has had 13 ratings above that.
After winning the 2014-15 final against the Sydney Sixers, the Scorchers had a rating of 1583, the highest in the competition’s history. This overtook the previous mark, set by the Melbourne Stars in their undefeated season.
Highest ratings in BBL history
| Team | Rating | Date | After | |
| 1 | Perth Scorchers | 1583 | 28/01/2015 | Final v SYDS |
| 2 | Melbourne Stars | 1578 | 27/01/2014 | R8 v PTH |
| Perth Scorchers | 1578 | 10/01/2016 | R7 v HOB | |
| 4 | Perth Scorchers | 1575 | 2/01/2016 | R5 v SYDS |
| 5 | Perth Scorchers | 1574 | 11/01/2015 | R6 v HOB |
| 6 | Perth Scorchers | 1573 | 25/01/2015 | SF v MELS |
| 7 | Perth Scorchers | 1570 | 7/01/2016 | R6 v SYDT |
| 8 | Melbourne Stars | 1569 | 21/01/2014 | R7 v HOB |
| 9 | Perth Scorchers | 1568 | 28/01/2017 | Final v SYDS |
| 10 | Perth Scorchers | 1567 | 16/01/2016 | R8 v MELS |
At the opposite end of the scale, the team that’s been the worst throughout history is the Sydney Thunder. This will come as no surprise to teams that have followed the BBL for an extended period. After winning their first two games in the first season (on December 17 and 23, 2011), the Thunder wouldn’t win again until January 14, 2014.
In addition, their rating of 1471 at the end of 2011-12 gave them the mantle of ‘worst team in the league’, which they wouldn’t relinquish until December 2015, when it passed to the Brisbane Heat. In that 2015-16 season, the Thunder would qualify for the finals despite having the worst rating in the league, and then go on to win the title. Unsurprisingly, they dominate the next list.
Lowest ratings in BBL history
| Team | Rating | Date | After | |
| 1 | Sydney Thunder | 1389 | 11/01/2014 | R6 v HOB |
| 2 | Sydney Thunder | 1396 | 8/01/2014 | R5 v BNE |
| Sydney Thunder | 1396 | 25/01/2014 | R8 v SYDS | |
| 4 | Sydney Thunder | 1402 | 14/01/2014 | R6 v MELR |
| 5 | Sydney Thunder | 1403 | 3/01/2014 | R4 v PTH |
| 6 | Sydney Thunder | 1410 | 1/01/2014 | R3 v MELS |
| 7 | Sydney Thunder | 1411 | 8/01/2013 | R8 v MELS |
| Sydney Thunder | 1411 | 22/01/2015 | R8 v SYDS | |
| 9 | Sydney Thunder | 1417 | 27/12/2013 | R2 v ADL |
| 10 | Sydney Thunder | 1418 | 17/01/2015 | R8 v MELS |
But all of that’s in the past. How does it look for the season ahead?
To start with, we can have a look at the chances for each team to beat every other team:
| ADE | BNE | HOB | MELR | MELS | PTH | SYDS | SYDT | |
| Adelaide Strikers | 48.99% | 53.02% | 50.00% | 46.98% | 41.31% | 48.42% | 50.00% | |
| Brisbane Heat | 51.01% | 54.02% | 51.01% | 47.99% | 42.29% | 49.42% | 51.01% | |
| Hobart Hurricanes | 46.98% | 45.98% | 46.98% | 43.98% | 38.41% | 45.41% | 46.98% | |
| Melbourne Renegades | 50.00% | 48.99% | 53.02% | 46.98% | 41.31% | 48.42% | 50.00% | |
| Melbourne Stars | 53.02% | 52.01% | 56.02% | 53.02% | 44.27% | 51.44% | 53.02% | |
| Perth Scorchers | 58.69% | 57.71% | 61.59% | 58.69% | 55.73% | 57.14% | 58.69% | |
| Sydney Sixers | 51.58% | 50.58% | 54.59% | 51.58% | 48.56% | 42.86% | 51.58% | |
| Sydney Thunder | 50.00% | 48.99% | 53.02% | 50.00% | 46.98% | 41.31% | 48.42% |
Pretty much all of the values are in the 50s or 40s, which is probably about where they should be. None of these teams have ratings too spread apart – as we saw before, second through eighth are all within 50 rating points of each other. And T20 is kind of random anyway, so trying to get judgement from this is a surprisingly difficult task.
Looking at it one game at a time makes it a challenge to see how the entire season’s going to pan out. But you guys are lucky I’ve done all the work for you.
| Proj Wins | Win Seas | Lose Seas | ||
| Adelaide Strikers | 4.83 | 33.55% | 41.90% | 6th |
| Brisbane Heat | 5.00 | 37.61% | 37.72% | 3rd |
| Hobart Hurricanes | 4.55 | 27.13% | 49.22% | 8th |
| Melbourne Renegades | 4.76 | 31.90% | 43.70% | 7th |
| Melbourne Stars | 5.19 | 42.51% | 33.02% | 2nd |
| Perth Scorchers | 5.83 | 58.93% | 19.64% | 1st |
| Sydney Sixers | 4.94 | 36.27% | 39.06% | 4th |
| Sydney Thunder | 4.90 | 35.27% | 40.12% | 5th |
Since a 5-5 season isn’t counted as either winning or losing, that’s why all of these sides don’t add up to 100%. And this also shows us just how far above the rest the Sydney Sixers are. Adding it all together, there’s an 80% chance that the Scorchers will break even for the year, which no other team even comes close to.
And if you’re curious as to their chances of getting a set number of wins for the year, that’s available too – in both the spreadsheet and this graph below.
For all of the teams in the BBL, the chart is a nice bell curve, but the only difference is in the centre of the pyramid – this varies from left to right and, unsurprisingly, depends on a team’s rating. And, again, shows how far ahead of the rest of the league the Perth Scorchers are.
Will these predictions hold? Check back in February.
Elo Ratings
Win Chances
Find all BBL Elo Ratings posts here.
1Possibly the single most Hungarian village name ever.
2Who was actually named Stanley Edgar.

4 thoughts on “Big Bash League Elo Ratings”